

%20(1014%20x%20640%20px)%20(8).png)
How silly do you feel when you search for your glasses only to find they are on your head? What if the key to improving your business is already in your possession? Valuable data hiding improvement insights may be concealed within your business. This article exposes the hiding spots and guides you through how to reveal potential.
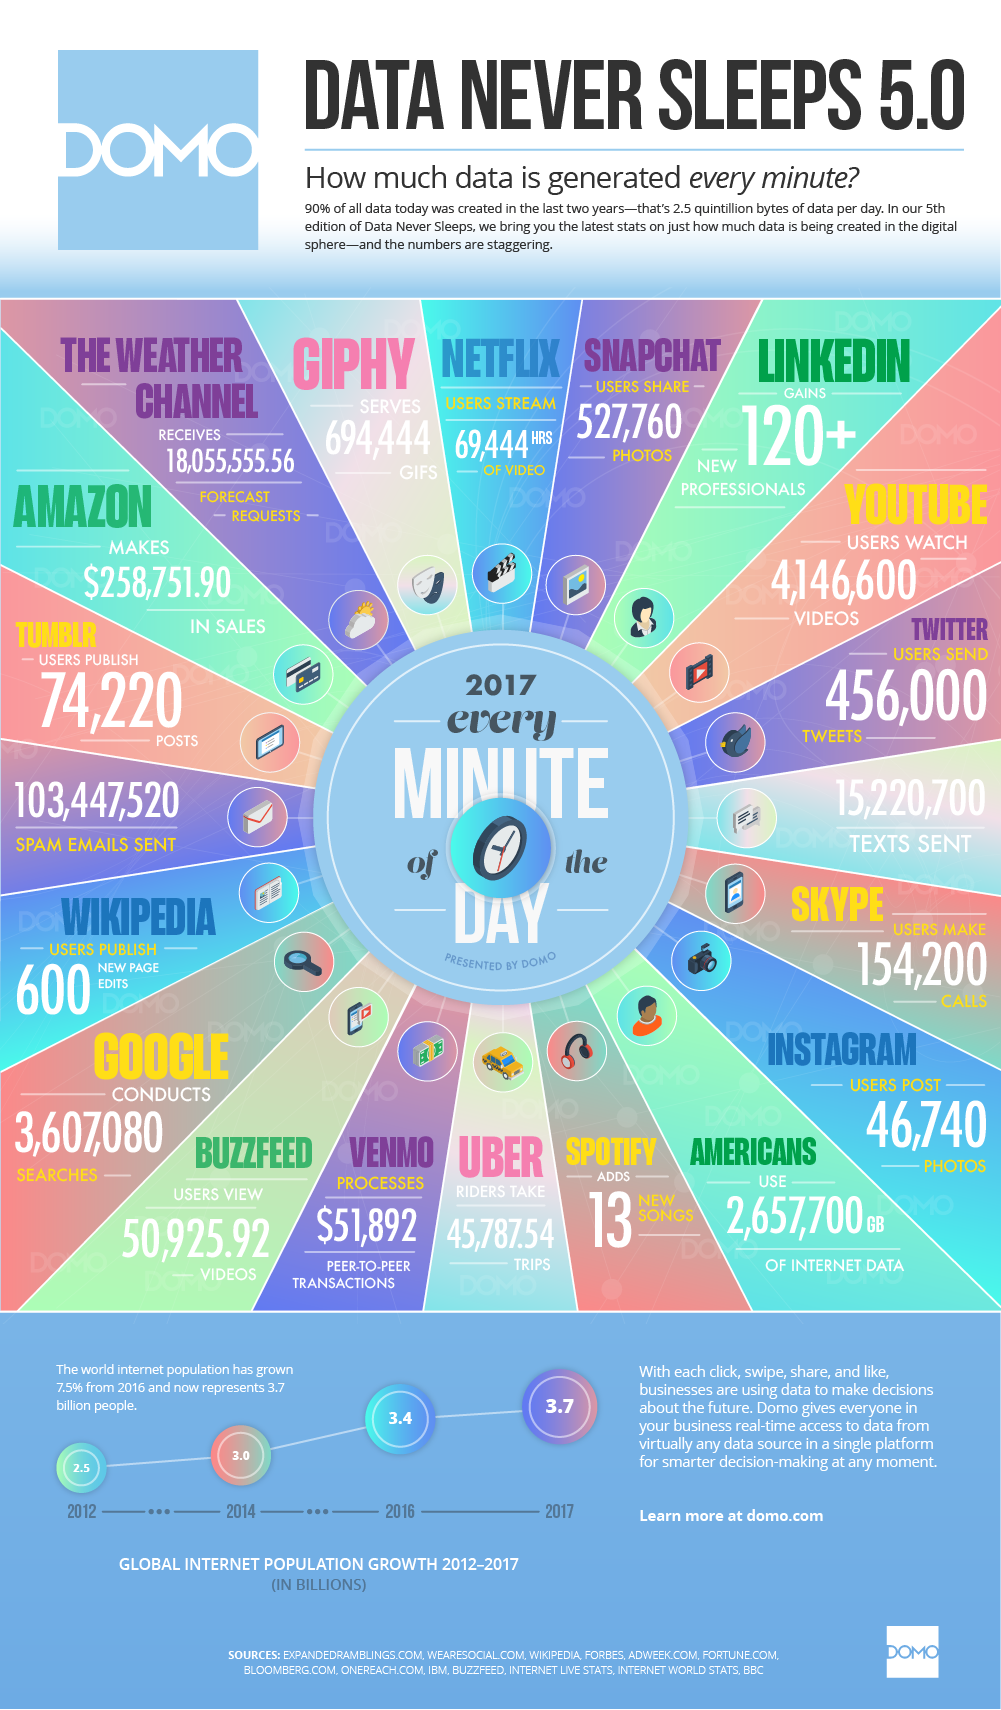
We generate 2.5 quintillion bytes of data every day. If every byte of data was a square mm in size we cover the earth’s surface almost 23,000 times every second! The average company has 162.9TB of data according to IDG, that’s roughly 7 years’ worth of back to back movies.
No wonder, “making life harder, not easier”, is how most business owners feel about using data, according to a study run by Humanalytics interviewing over 60 small and medium business owners.
Data can feel too difficult, too time consuming and frankly intimidating. But if the answers to improving our businesses are buried in our data, surely, we want to gain access?
Before we look at how to gain access, lets reveal some hiding spots.
Most people have a level of discomfort with data, it can be confusing and overwhelming. Dark data may conjure up images of something to fear but there is nothing scary about dark data. It refers to unused data, collected by organisations but not used. Gartner defines dark data as “the information assets organizations collect, process and store during regular business activities, but generally fail to use for other purposes”.
And between us we have a lot of it.
IBM reported in 2015 that it makes up 80% of all data and predicted that it would grow to 93% by this year.
Is your business collecting data and not using it?
Almost definitely the answer is yes.
Every business has data, even those that are not ‘digital’ have invoices and stock levels. You are probably aware of some collected and unused data:
There are probably places that you don’t know you have data too.
When we think of data, we often imagine a data base with columns and rows much like a spreadsheet but not all data is structured and organised. There are probably data repositories that you don’t think of as data.
The emails in your client facing inbox hold valuable data about mistakes, common questions, issues and things your customers love you for.
Your staff unwittingly hide reems of data in their heads. Just waiting for someone to ask the right question to retrieve it.
Your systems probably have hidden data too. Bespoke systems running processes often have data collection put in place by a previous technician that the current ones don’t know about. Or perhaps they do know but didn’t realise it would be useful to answer your questions.
Even the standard systems hold lots of data, calendars can shed light on how time is spent, folders can shed light on how often things are updated and by whom.
Even physical things might be data. How much shelf space you have in your shop? How many spares you keep in your repair shop? How far each member of staff walks to the printer?
So what? So what if I have data but don’t use it? Does it matter?
I recently redesigned my kitchen and went crazy on storage. I have 23 cupboards in my kitchen, 4 are currently completely empty. Those 4 cupboards aren’t providing me any value at the moment, but I know my kitchen gadget collection will continue to expand.
Much like my cupboards data doesn’t hold value until it’s needed. Data storage has a cost, just like my cupboards are taking up space but this is fairly marginal.
I don’t get it why am I telling you not to worry about something you weren’t aware of or focused on anyway?
It does matter when you want to make a change. When you want to improve your business you will need to answer questions.
When I finally get the ice cream machine I’ve been coveting, one of those four cupboards will suddenly be very valuable to me. When you need to improve your business that ‘dark data’ that is just sitting there could hold the key to how to do it.
Let’s be honest, who doesn’t need to improve their business right now?
When you’re improvement planning you’ll know the areas that need addressing. For every business there are two main categories. Reduce costs or increase revenue. You could address both these categories in a multitude of ways.
As a business leader, it seems easier to reach for solutions that cost money.
Sometimes, however, this is solving the wrong problem. If you redesign your website but the real problem is not enough relevant incoming traffic, it won’t have as much of an impact as you would like.
Figuring out what to do is the art of business. That’s where data comes in. That ‘dark data’ becomes valuable when it applies to answering a question. Knowing where to look for potential answers to questions and how to organise data to answer them is how you take the first step in improving your business.
Anyone can access and analyse data that will make a difference, even if you are a little afraid of data or consider yourself ‘bad at maths’. The trick is working out the questions you have before you even start to think about touching the data.
The rest of the article walks you through step by step how to turn your dark data into business success.
You have an intuition about the area that will make a difference to your business. Whether it is a subcategory of reducing costs or increasing revenue. Start by filling in the potential blanks in the sentence if… then…
For example, if your goal is to reduce costs by making your staff more efficient perhaps your sentences would be
Or if your goal is to increase revenue by increasing average customer spend
‘If this was improved would it have an impact?’
Sense check to make sure you are on the right track. You can do this without hard data by asking yourself or staff a few questions. They won’t be validated or accurate but directional information is all you are looking for at this time.
If staff spent half the time dealing with complaints, what would the impact be? If 10% of customers bought downstream products from you what would the impact be?
If the impact isn’t worth it focus on a different area.
Next, look for the questions behind the question, a phrase I have stolen from one of my most respected former bosses. The questions behind the question answer the ‘how’ or ‘what’.
Let’s take our first if…then… from above. If staff spent less time answering customer complaints then they would be more efficient.
Our questions behind the question could be:
Always start with questions never start with data.
One of the most common data analysis mistakes is using the data you can easily access and producing every percentage, count and average you can come up with. Often this just takes up time but doesn’t really tell you anything of value. Remember, data only has value if it answers a question that will have an impact.
Brainstorm where you might find data to answer your questions. Think outside the box and don’t forget that a lot of your data is hidden.
Let’s use our customer complaints question again
Question behind the questionPossible data sourcesHow much time are they currently spending answering customer complaints?How many emails come in?
How much time do staff think they spend dealing with complaints?
How many staff members do you have focused on this?
Could you search email sent items for the word ‘sorry’ or ‘apologise’ to give you an estimate?What is causing customer complaints?Do you have a field that customers fill in you could use?
Could you search emails for keywords to determine the cause?
Could you use the emails sent by you customer facing staff to understand the cause?What proportion of customers complain?Could you map the email domains of the customer complaints emails to the database of customer details you have?
Could you assess average number of customer complaint emails against average number of sales per day, per week?What method do they use to complain?Ask your staff?
Look at your website analytics?How many responses does it take to resolve a complaint?Could you look at the number of emails sent to the same email address from your customer facing staff?What types of complaints take up the most time?Could you take a time stamp from the first interaction to the ‘is there anything else I can help you with’ email from your staff?
Your data probably won’t be perfect and that’s ok. You are looking to improve your business not perfect it. In our example, we are looking to reduce time spent on complaints and wouldn’t expect to reach zero.
It’s what will have impact that counts.
I’ve seen lots of business leaders give up on data analysis because of the 100 complaints they were looking at 10 didn’t fall into a neat category. It doesn’t matter, would that last 10 change the direction of your decision or action? Probably not. On the other hand, if you improved 90% of the problem would that have an impact? I bet it would.
Sometimes it’s obvious what to do, once you have accessed the data that answers the questions.
If you discover:
Look for bright spots. Within each issue there are usually some parts that work well. A staff member is achieving higher results or a particular product bucks the trend. Clone the good.
Do some of your packers never get complaints about missing parts, what are they doing differently? Do some of your staff seem to resolve complaints more quickly, what approach do they take that’s different?
And finally, don’t forget to measure your success. You probably figured out a better way to track your data as you were seeking data sources. If you didn’t you can take the same measures again after you have implemented change and tweak what you are doing for an even greater impact.
It would have been so easy to reduce the time it takes for staff to handle complaints by paying for an expensive system to handle complaints when all you needed to do was dig into the data you already had.
I specialise in this process and I’ve seen success addressing a multitude of questions such as reducing staff cost, increasing productivity, optimising travel budgets, improving quality while reducing cost and many many more.
I’d love to hear about your success story and how data has helped you improve your business. If you want to talk through your specific question or need help bringing data into the light, please do get in touch.
.png)